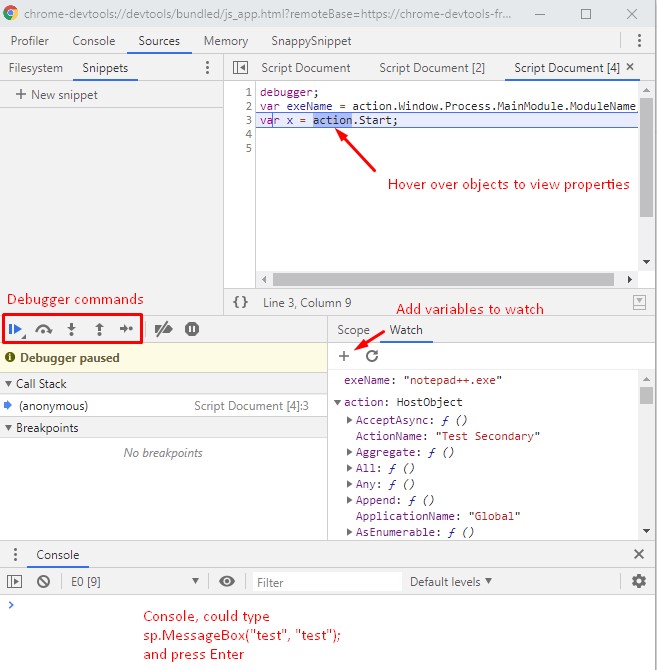
If you're having difficulty with a script or finding values of objects within the script, you can enable debugging to be able to examine and step through your script's code.
To start, you must enable V8 script debugging:
Options > Advanced > Enable V8 Script Debugging*(you
must restart S+.net after turning on this option!)
You can use any JavaScript debugger that supports connecting to the V8 engine like Visual Studio Code (see here on how to configure VS Code:
https://microsoft.github.io/ClearScript/Details/Build.html).
But it's much easier to use Chrome by navigating to:
chrome://inspect/#devicesMake sure the Settings window is closed,
then go to
chrome://inspect/#devices since reloading the scripts engines can sometimes disconnect the Chrome debugger.
Wait few seconds (sometimes up to 10 seconds) for the list to show, you should then see a Remote Target list with StrokesPlus.net.exe, click the
inspect link.
This will open a dev tools window; note that since each script is loaded and executed dynamically, you won't see much or anything until a script is executed.
In the script you want to debug, add this line where you want to invoke debugging:
Then execute your action, once that
debugger; line is hit in your script, the debugger will show you the script and let you debug.
From there you can browse the action object, for example, and generally just walk step by step through the script to troubleshoot any issues you're having.
You can also go to the Console tab and execute script commands directly. I haven't spent a lot of time using this, but there is a lot one could do!
In the context dropdown, the items listed are the script engines. E0 is the first, E1 would be the second, etc. This generally isn't something which you'll need to worry about, but if you were debugging a script which also had a timer script running, it might show up under the context of a different script engine since you're debugging the first one.

Edited by user Wednesday, October 14, 2020 8:08:59 PM(UTC)
| Reason: Not specified